
Can you say your life path has been a straight one with no stop offs or detours? For many pets, their trajectory to better health and welfare is often not a straight line, but inevitably there are slight dips, curves, and/or big detours. This is probably more the norm rather than the exception. And while relapse in our pet’s behaviors often has nothing to do with the humans in their lives, it nevertheless can certainly affect us.
A few months ago SeeKao, one of our dogs, started trending towards a dip. While we were out on our walk, she demonstrated some of the anxious behaviors that we hadn’t seen in a long while. I confess it was a horrible walk for probably both of us, her being anxious and me feeling a pang of despair, a bit of frustration, and sadness to see our girl having concerns. I thought about a couple of summers ago when she walked near the lake and how, by being in a less anxious state, she conquered her fear of getting into the water. That summer she dipped in the water, eventually up to her neck and I thought she was close to launching herself to a deeper spot and maybe even swimming. Well that was then and this is now.
For a lot of pet parents who are in the midst of a training plan or maybe feeling or wishing that they are nearing the end of the plan, a relapse of any sorts can be very demoralizing and it might make you even feel like throwing in the towel.
It’s times like this when data can help you examine if this is a blip in an otherwise positive trending trajectory (i.e. this dip is an anomaly), short term noise (e.g. there’s been a temporary change to the environment or routine that is causing a temporary setback), or if there has been a slow trend in that direction. Data can help to identify if the dips are happening in any kind of pattern. Patterns can possibly inform us about the context in which the dip is happening, which can give us information about why it’s happening and what we can do about it.
Information gathering can take a lot of different forms. I urge pet parents I work with to use a process that has ease of entry and is sustainable. It is easy to go down a rabbit hole of collecting a bunch of data that takes a lot of time to enter and results in a mountain of information that may not help you see, for example, a trend or pattern.
Types of data to collect:
- Counts or frequency of events. For example: how often your dog is triggered by sounds or the number of times on your walk that gives your dog big feelings about other dogs (or people, etc.) or number of times your cats are having negative interactions with each other.
- Intensity of event. For example: when your dog reacts to the delivery truck coming down the driveway is it a minor head lift, a go to the window to look, the latter plus a few barks, incessant barking, or over the top arousal at the window?
- Duration of event. For example: how long was the period of time that your cat had big feelings about the trigger, or how long did it take them to return to a calm state?
- Descriptions of what was happening right before the given episode or event, observations about the situation of interest, or details about how the human responded.
Ways to collect data can include:
- Put a paper calendar in a handy location like on the fridge or by your teapot so you can easily jot down info;
- Create a google calendar and enter info as events;
- Create a google sheet that can be shared across family members; or,
- Put notes in your phone or in paper journal
Let’s face it: it’s easy to feel down that you’ve been putting in a lot of effort to support your pet and you feel either like your pet is not making the progress you think they should be making or that things are headed in the wrong direction. Taking the time to track their progress can make a big difference. Look to see, for example, if the actual number of episodes is the same as when you started. You may feel like you haven’t made progress but in fact the episodes are fewer or perhaps of lower intensity. Sometimes these nuances are hard to see unless you look at real data.
Progress tracking can be a useful tool to help keep your eye on a longer term goal. It can also help you to see if this week, which feels like it’s all gone south and your pet has relapsed, may be just a blip in what otherwise are trends in the desired direction.
I hope I’m making the point that data can be useful but there is no need to go overboard, like spending loads of time collecting so much information that it is too overwhelming to use anyway.
Try to stick to data that will help inform whether your pet is progressing towards your goals or whether your plans need to change to make better progress.
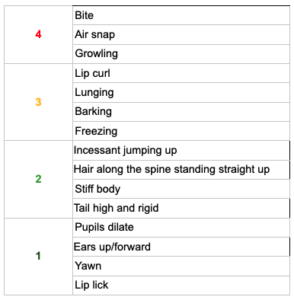
For example, I like to create a rating scale that easily maps on to my pet’s behaviors so I can plunk in a simple number into a google sheet.
Now What?
- If you aren’t tracking your pet’s progress, think about what kind of information would be useful to collect.
- Next, think about what method of recording would be simple and accessible to the people who need to enter data (if more than one person will be collecting information).
- Trial your system for a few days or a week and then assess whether it’s working or not working for you.
- Lastly, if your pet looks like they are having a relapse of sorts, sometimes having another pair of eyes to see what’s going on can be useful; don’t hesitate to reach out to one of us! We’d be happy to help troubleshoot.
Happy Training!
Tracy


Great advice Tracy. I’ve done something similar with Atticus in the past and have let my data collection slide a bit. I will have to think about whether to start up again. Not sure I’m seeing any general backsliding but keeping data also helps for when a bad day does come along and I can look at all the good days and not get discouraged by one bad day.
Thanks Gwen for sharing how data tracking has helped you and Atticus!